

Analysis: COVID-19 and Real Estate Trends
/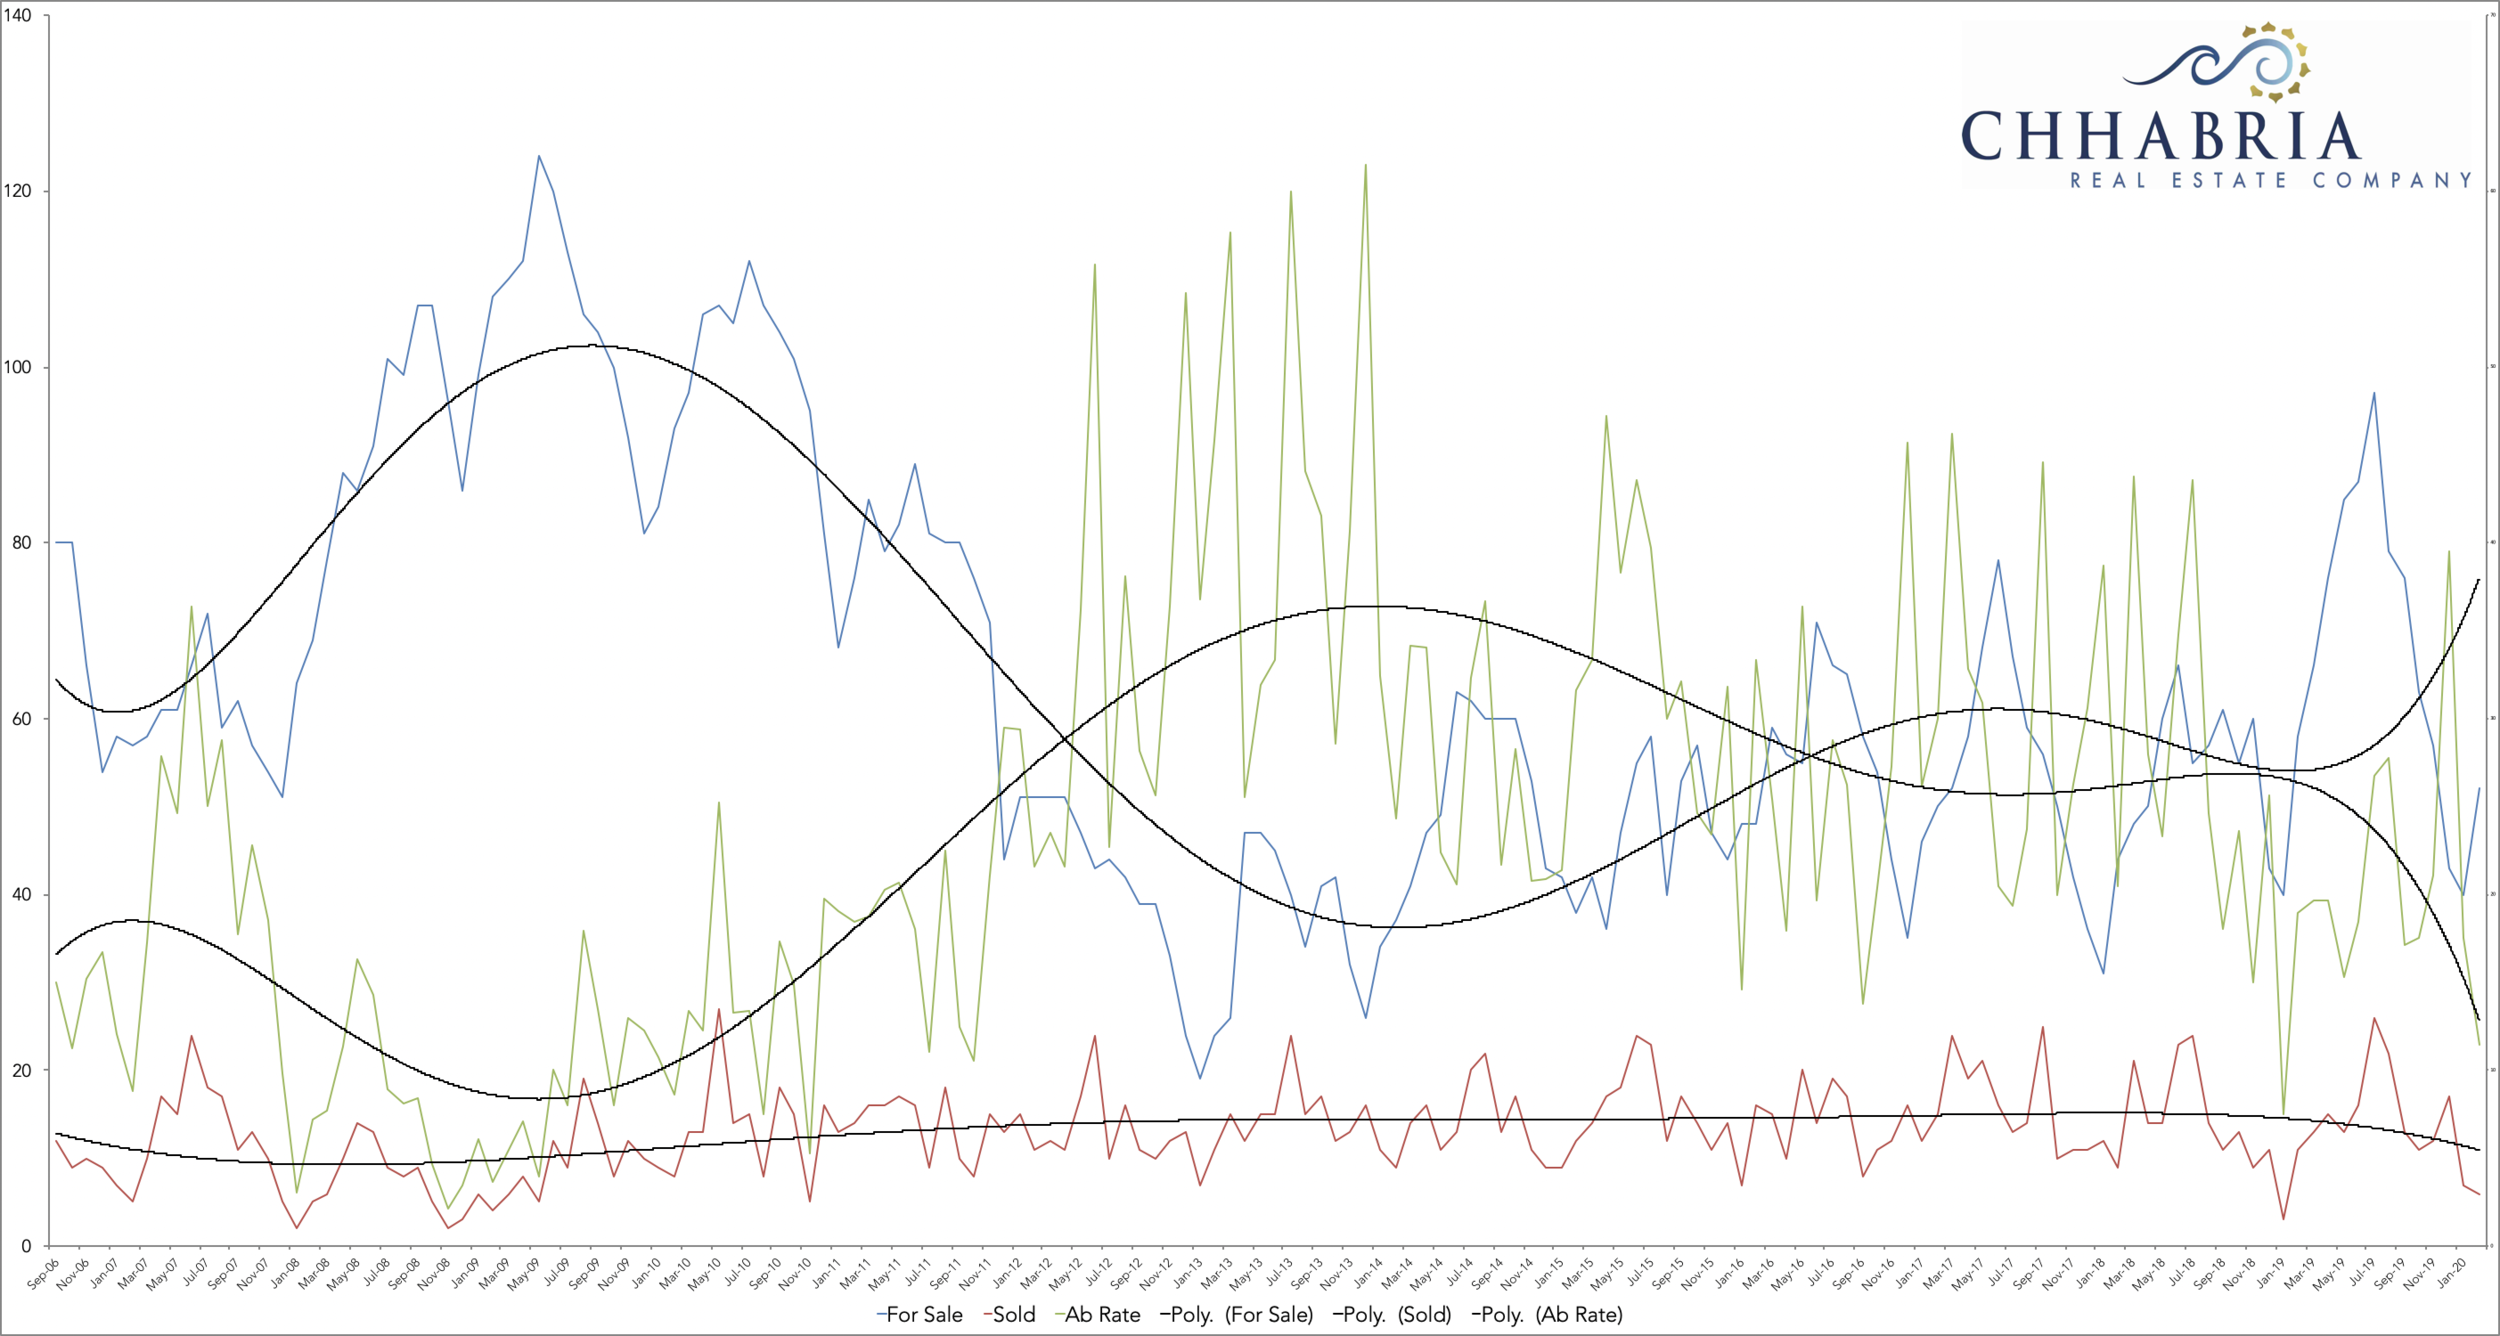
September 2006 to January 2020 data of homes for sale, homes sold, and absorption rate for Palos Verdes Estates, California.
Going through through the market reports, I decided to take a deeper look at the analytics and offer commentary on the statistics. This post is focused on Palos Verdes Estates and goes as far back as 2006 in order to analyze trends in the data. My hope is to provide some insight about how we can expect the market to behave moving forward.
The attached graph shows “Homes for Sale” in blue, “Home Sales” in red, and “Absorption Rate” in green. Absorption Rate is a percentage of the amount of homes being sold or pended each month). Several key points stood out to me:
December 2011 to May 2014 was the longest stretch of “low inventory” (less than 50 listings). I suspect sellers decided primarily not to list due to a bad market. For context, the November 2007 to November 2011 average of monthly inventory was at minimum 60 listings, however usually the average is approximately 80 listings for sale.
After March 2017, we begin to see inventory levels increase, but nothing like September 2008 or September 2010. At the time of writing this (late March 2020), inventory levels in Palos Verdes Estates look similar to September 2006 and September 2008.
Average days on the market has been consistent since 2008. In the down market, average days on market was over 60 days and in a strong market usually under 60 days. As of recent, it seems there has been a slight increase in days on market and slowly starting to increase to over 60 days on market.
Historically, inventory seasonally decreases around November, then begins to increase in March, peaking into the summer months.
It is hard to forecast or make predictions since the COVID-19 pandemic is unprecedented. We simply don’t have much historical information to draw comparisons. Before COVID-19, it seemed as though inventory and overall market activity was about to increase, per usual this time of year. Inventory levels finally seemed to get to a healthy level last summer and it felt as if we were on a similar track this year.
In conclusion, our market pre-COVID-19 was ready to soften due to rising inventory levels, but certainly not crash. The market crash/financial crisis of 2008 was originally spurred by the Lehman Brothers bankruptcy. At that time, home inventory was at an increased level, relatively speaking, and transactions and prices decreased in the years following. Today, inventory levels are increasing and while we’ve been hit with another disaster, it is of different nature: not fundamentally systemic and hopefully short-term, as opposed to the financial crisis. If we are able to exit this disaster and quarantine by the end of April, like the government and society hopes, we will hopefully only have a minor correction.